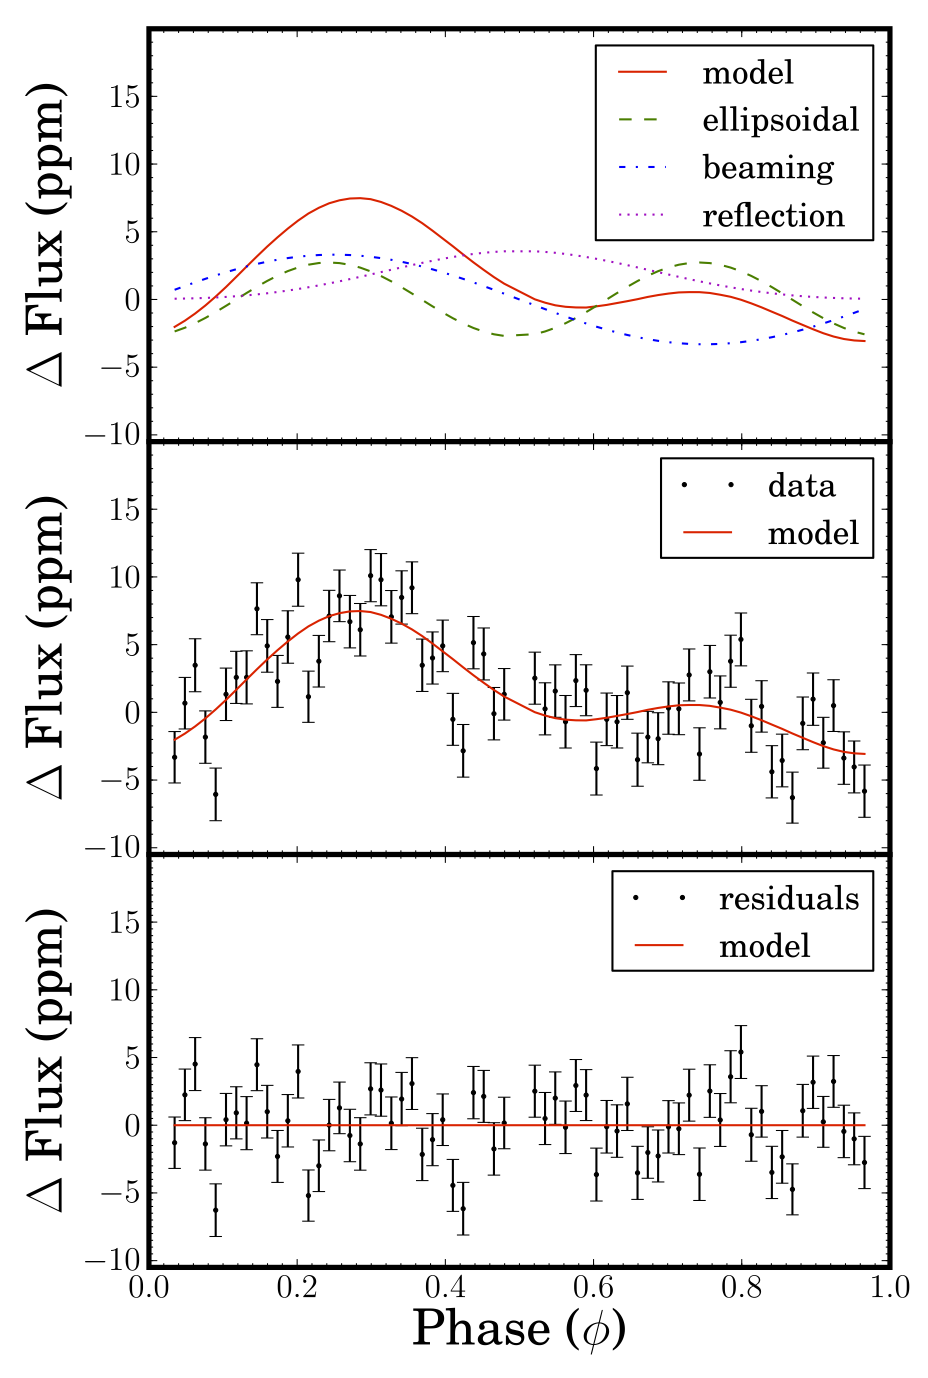
The blog post feels a little egocentric as I am going to discuss a paper I wrote which has recently been accepted for publication in ApJ. It is a paper which is based on the Kepler data of a star known as TrES-2 and the science we were able to deduce from small brightness variations we measure.
TrES-2 is a star a little smaller than our Sun which falls into the field of view of the Kepler spacecraft. TrES-2 was one three stars in the Kepler field known to host a transiting exoplanet pre-launch (the other two being HAT-P-7 and HAT-P-11). The planet is of similar size to Jupiter and orbits with a period of just under 2.5 days.
One of the keys to understanding exoplanets is understanding the star’s that host the planets. This is because the two most productive techniques for discovering new exoplanets (the Doppler method and the transit method), measure a planet’s mass (for Doppler) and radius (for transit) relative to the stellar mass and radius. Without accurate stellar parameters own knowledge of the planet is severely restricted.
In the case of TrES-2 we were able to determine with very high precision the star’s mass and radius by measuring seismic oscillations on the star’s surface. This technique, known as asteroseismology, is very powerful and is one of the very few ways with which to accurately determine stellar parameters (another being to directly image the star).
With these parameters in hand, the next step was to determine some planet parameters. TrES-2 is fairly bright and has been observed for the entirety of the Kepler mission. As such, the data we have for TrES-2 is some of the most exquisite exoplanet data ever obtained. We were able to observe a number of effects that until recently were thought impossible to see.
Doppler Beaming: The gravitational pull of the planet on the star causes the star to move towards and away from the observer as it orbits and can be seen as a radial velocity shift. This is the principle used to find planets with the Doppler method. It turns out that this effect can also be seen as a variation in the brightness of the star owing to a special relativistic effect known as Doppler beaming. As the star moves toward us, it’s light cone gets beamed very slightly towards us resulting in a slight increase in brightness. As it moves away it gets a little fainter because the light from the star is beamed away from us slightly. The change in brightness induced by transiting planets is very small. For TrES-2 the star only changes in brightness by 3.4 parts per million. Small but (just) detectable.
Ellipsoidal Variations: The gravitational pull of the planet on the star actually deforms the star slightly (remember, the star is a fluid). As the planet orbits the star, we periodically see more then less surface area of the star. The more surface area of the star we see the brighter the star appears to be. The deformation affect may only be to increase to the size of the star along one axis by 10 km or so but again this effect is just detectable. For TrES-2 we detected a modulation in the star’s brightness of 2.7 parts per million.
The reason why the detection of Doppler beaming and ellipsoidal variations is interesting is that both are gravitational effects and hence both depend on the mass of the planet. Therefore, by measuring the amplitude of the effects we directly measure the mass of the planet. This is very exciting as usually determining planet masses is a time consuming and expensive effort involving many nights typically using a very large and expensive telescope. Here we get it for free (almost, I still need to eat).
Phase Variations: Another effect we measured is similar to the different phases of the Moon we see from Earth, as a planet orbits a star we see the day side of the planet followed by the night side. When we see the day side of the planet, we see light. We measure a day and night brightness ratio of 3.4 parts per mission. We are also able to measure an albedo for the planet. TrES-2b was already thought to be the darkest exoplanet. We now report that this planet is about half as bright as we previously thought.

The model phase curve of TrES-2b is shown in the top
panel with the three constituent part which make up the model:
The ellipsoidal effect (green dashed curve), the Doppler beaming (blue dot-dashed curve) and reflection/emission (purple dotted
curve). The sum of these effects is the final model, shown by the
red solid line in the top and middle panel. The phase folded Kepler
data is plotted in the central panel. The residuals of
this fit are shown in the lower panel. The constant offset in our fits
has been removed from the models shown for ease of comparison
and the transit and occultation has been cut out. Data has been
binned in the figure with 15,000 short cadence data point making
up each bin, for ease of interpretation. The fit described in the
text was performed on un-folded and un-binned data.
